Overview
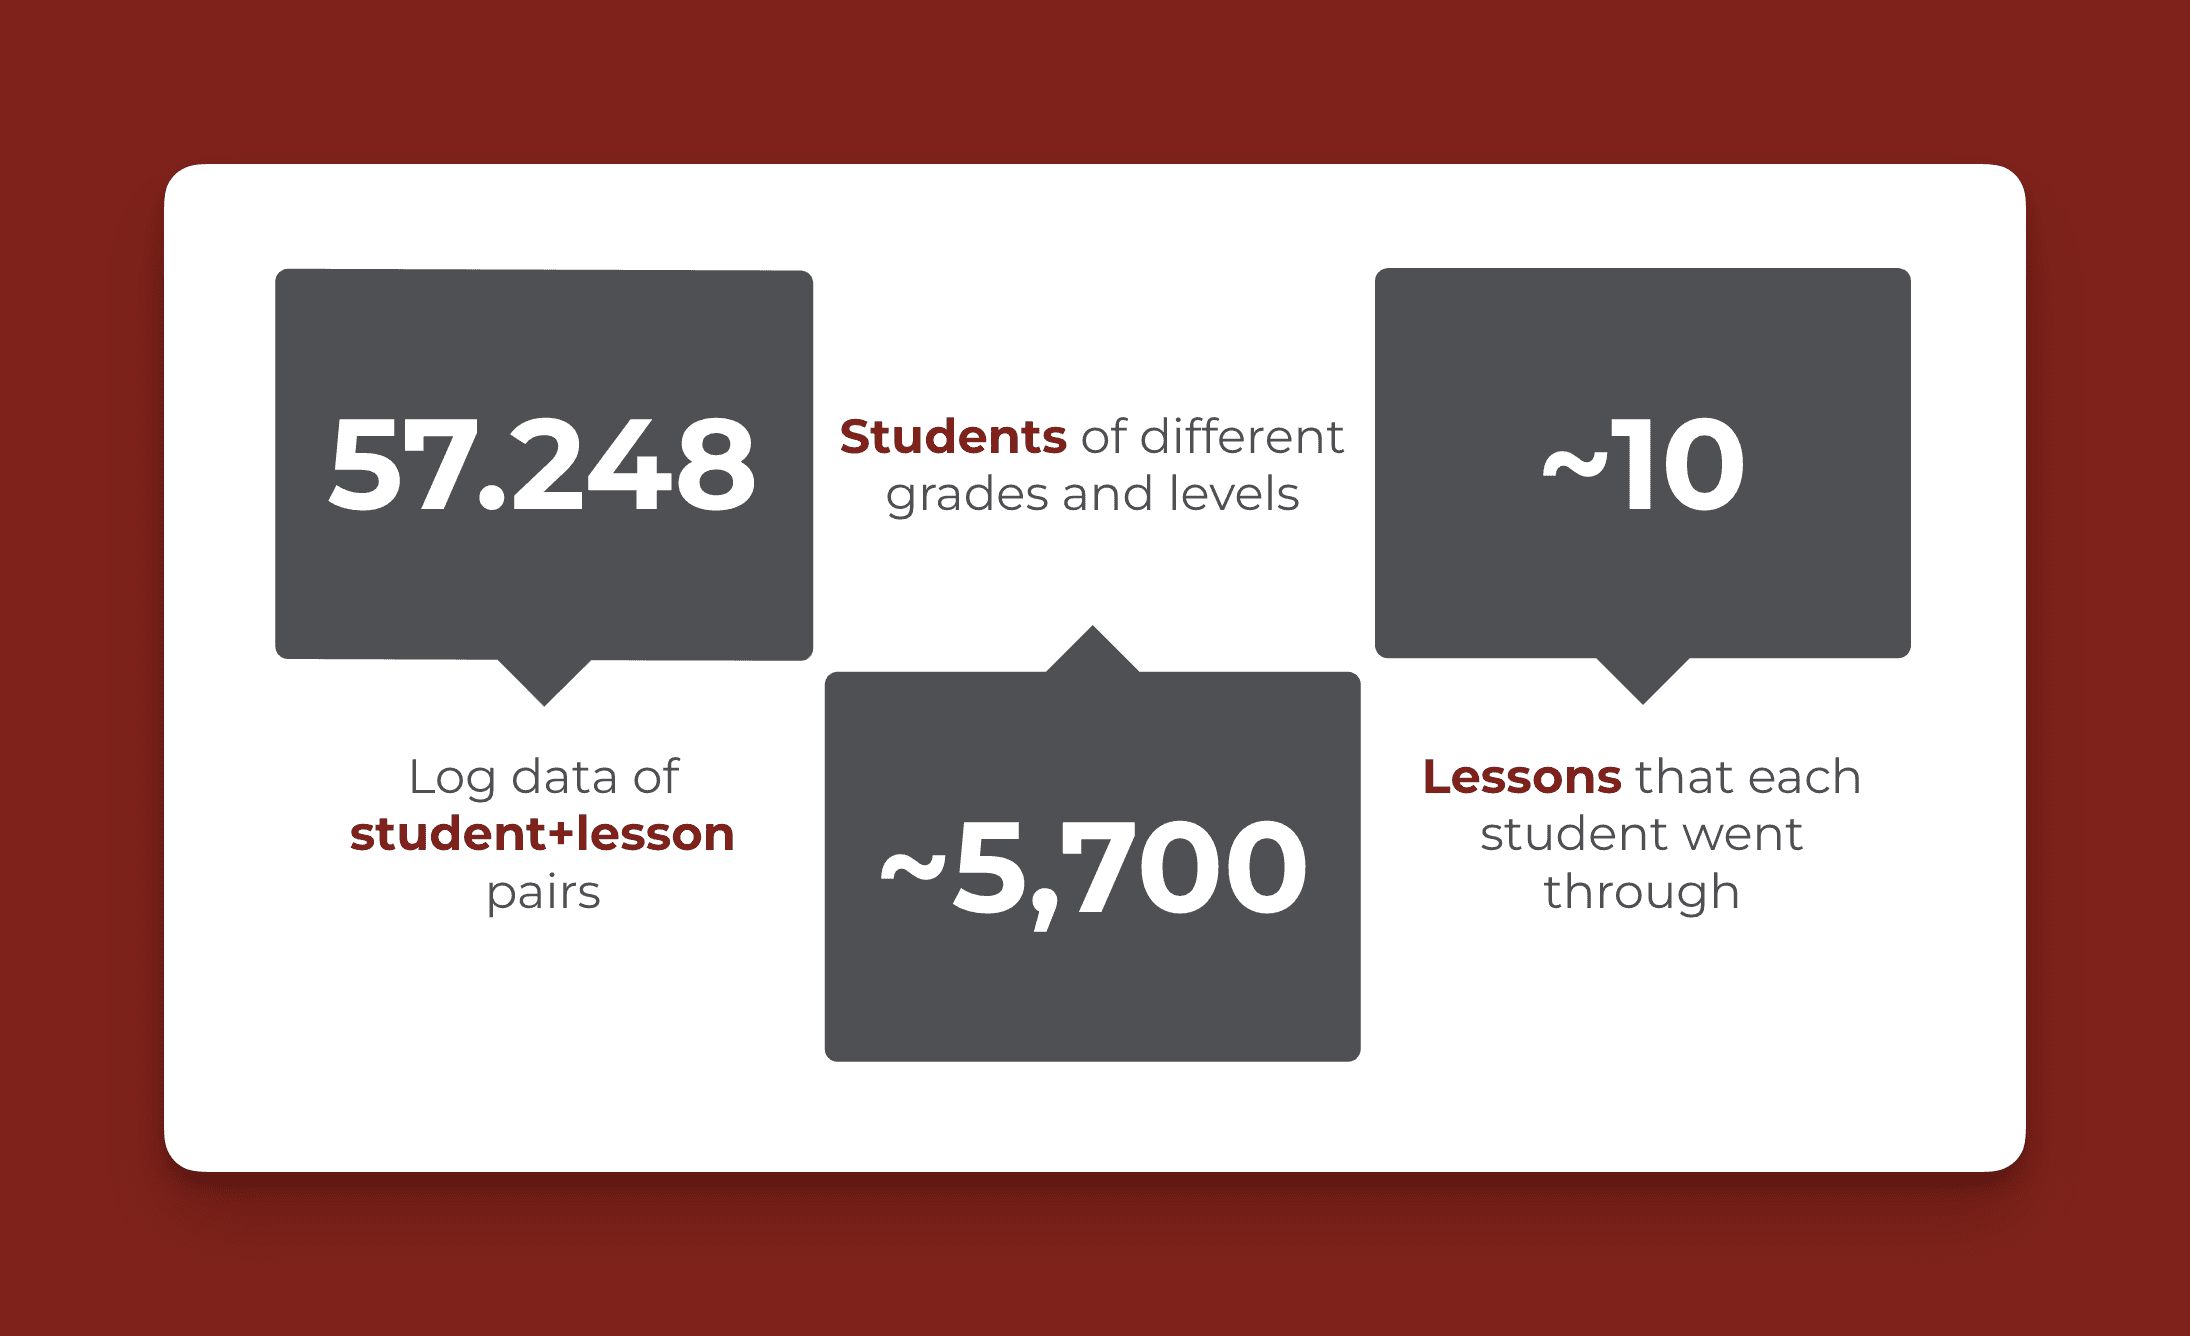
In this project, we analyzed data from Think Academy's online learning platform to understand how different types of in-class activities affect student performance. By working with over 57,000 data points from nearly 5,700 students, we used machine learning techniques to identify which teaching strategies were most effective at improving homework completion rates.
The Challenge
When it comes to measuring student engagement and success, we traditionally think of classroom observations, teachers taking notes, and evaluating performance through tests and quizzes. But technology has dramatically transformed this process. Enter Technology-Enhanced Learning (TEL) and Game-Based Learning (GBL) – these approaches have redefined how we collect and understand engagement data – especially in online learning settings. Think Academy is one such educational platform, offering gamified and interactive learning experiences in subjects like math and English. The question is, how do these in-class activities influence student performance outside of class?
Our project aimed to answer this by studying the relationship between what happens during Think Academy’s online classes and how students perform on their homework. We focused on students who participated in Think Academy's math program during the Summer of 2023—a group of nearly 5,700 students who engaged in 57,000 activities across ten different sessions. By leveraging data science techniques like Random Forests and Gradient Boosting, we tried to understand whether activities like game questions or virtual rewards could predict how well students did on their homework.
Data
Our dataset was made up of log data from Think Academy’s platform—in other words, a detailed digital footprint of student activities during lessons. These activities ranged from basic interactive questions (e.g., multiple choice) to gamified experiences like “Candy Bomb”, where students earned virtual coins.
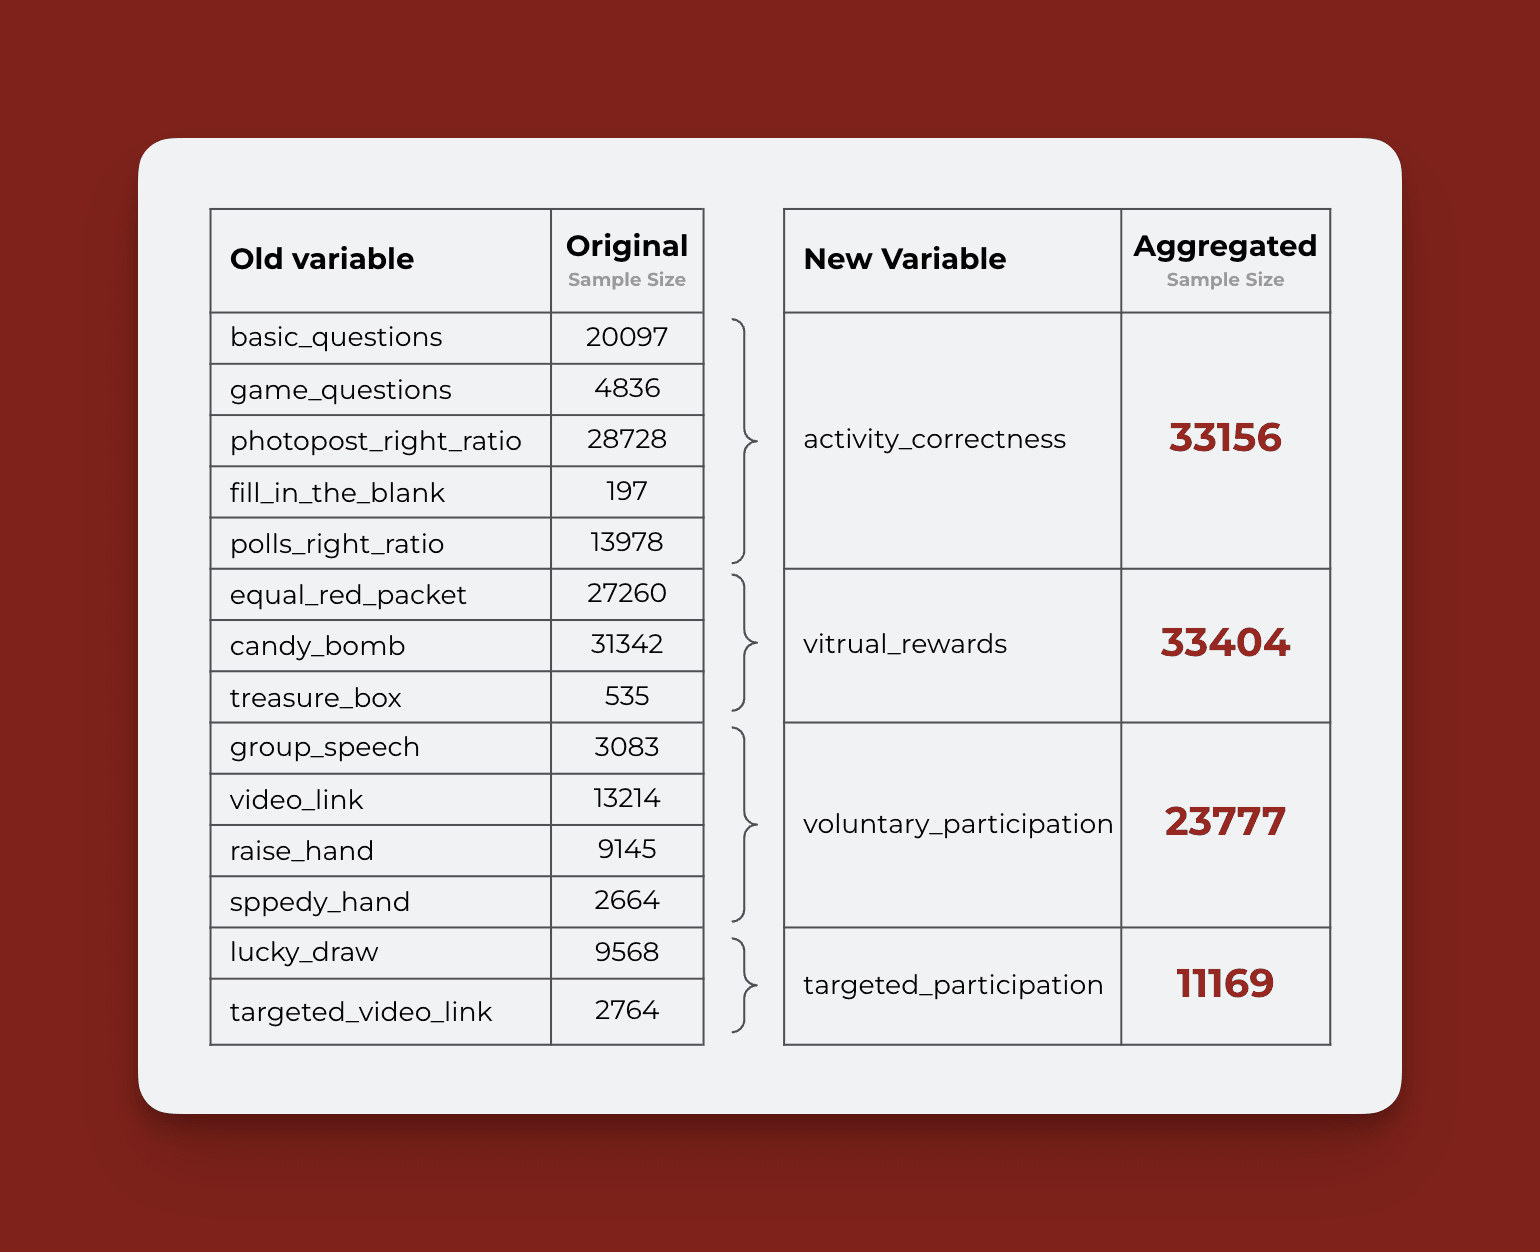
Each type of activity was categorized into four main groups:
Content-Related Activities: Questions like multiple choice or fill-in-the-blank.
Virtual Rewards: Activities like “Candy Bomb”, meant for engagement rather than learning.
Voluntary Participation: Actions like raising hands or speaking up in class.
Targeted Participation: Activities like random selection (“Lucky Draw”).
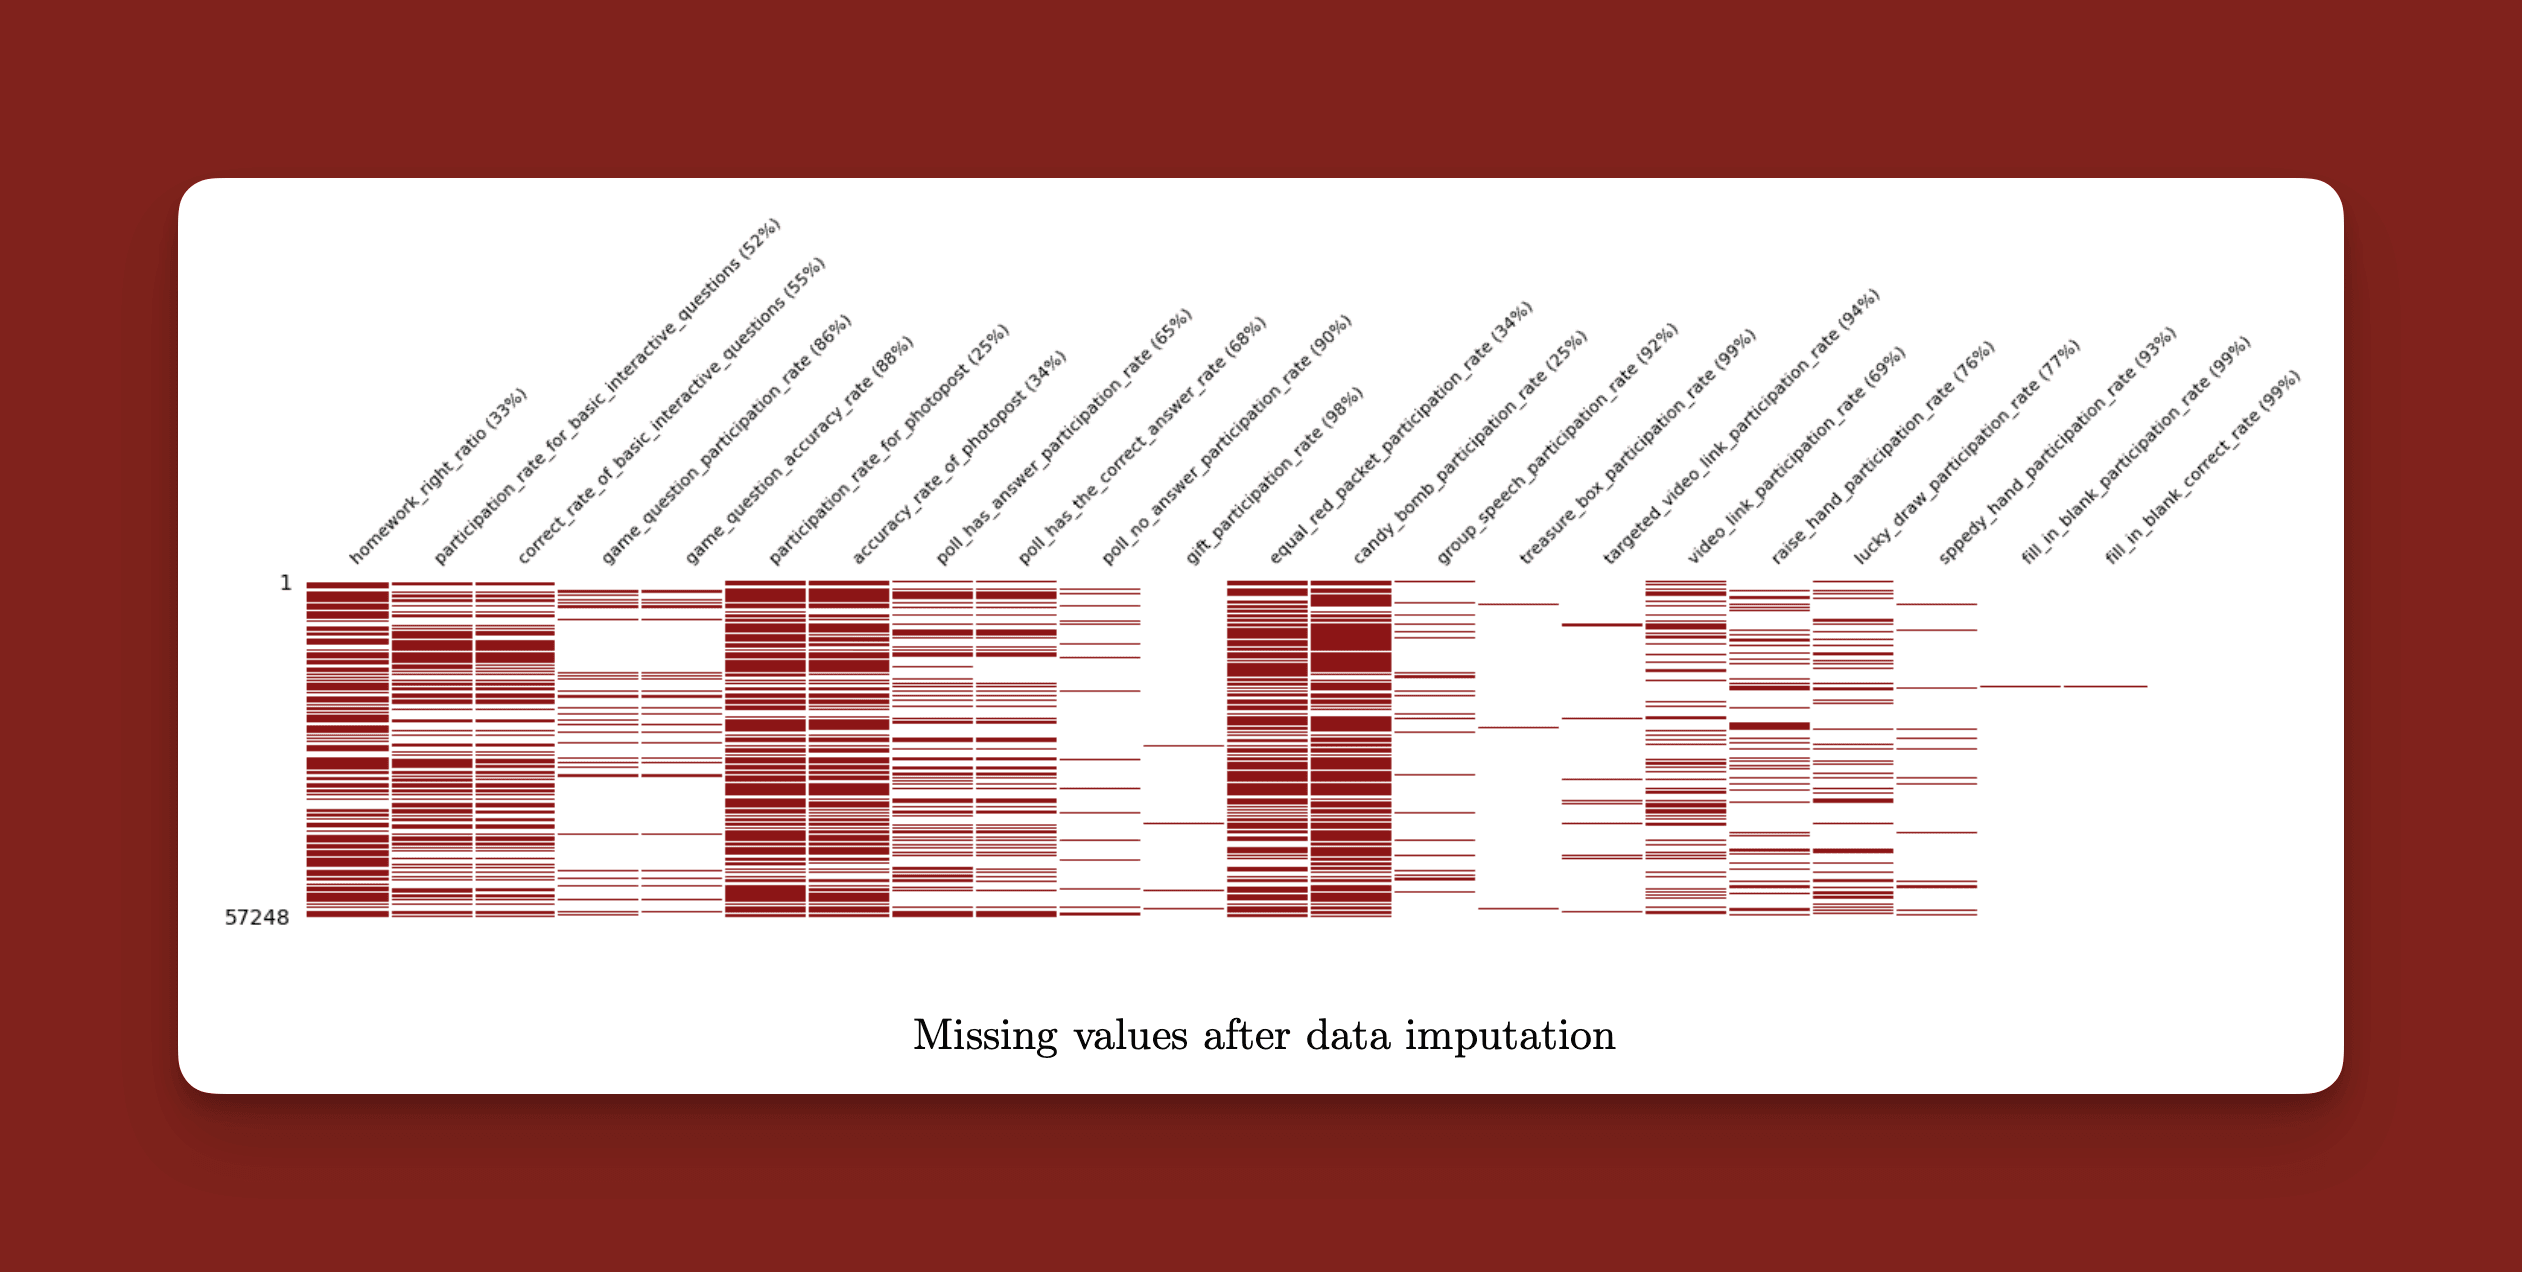
One interesting feature of the dataset was the presence of gaps and inconsistencies. Not all activities were performed in every lesson—a student could have logged into a class but not participated in certain activities, leading to missing data points. We handled this by imputing data where possible and aggregating variables to reduce data loss.
Ultimately, we conducted our analysis at two levels: individual student-lesson level and class-lesson level.
Data Processing & Feature Engineering
The initial dataset included over 20 variables tracking student participation and performance across different activities. To prepare the data for analysis, we conducted several key steps:
Data Cleaning: We removed duplicate entries and ensured that all timestamps were synchronized correctly to create a unified timeline of student engagement.
Feature Engineering: We created composite features by aggregating participation rates across similar activity types. For instance, we combined all voluntary participation activities (e.g., raising hands, group discussions) into a single metric to provide a broader view of student initiative during lessons.
Handling Missing Data: Missing data was addressed through a combination of mean imputation and adding binary indicators to account for missingness patterns. This allowed us to minimize data loss while still acknowledging the presence of inconsistencies.
Normalization: To handle differences in scale across the variables, we applied min-max normalization to ensure that features like participation rates and correctness ratios were on comparable scales, helping the machine learning models perform better.
We faced several data quality challenges:
Missing Values: Activities weren't consistently recorded across lessons.
Variable Distributions: Many metrics showed bimodal distributions.
Data Imputation: Needed to carefully handle cases where students attended but didn't participate.
Methods & Results
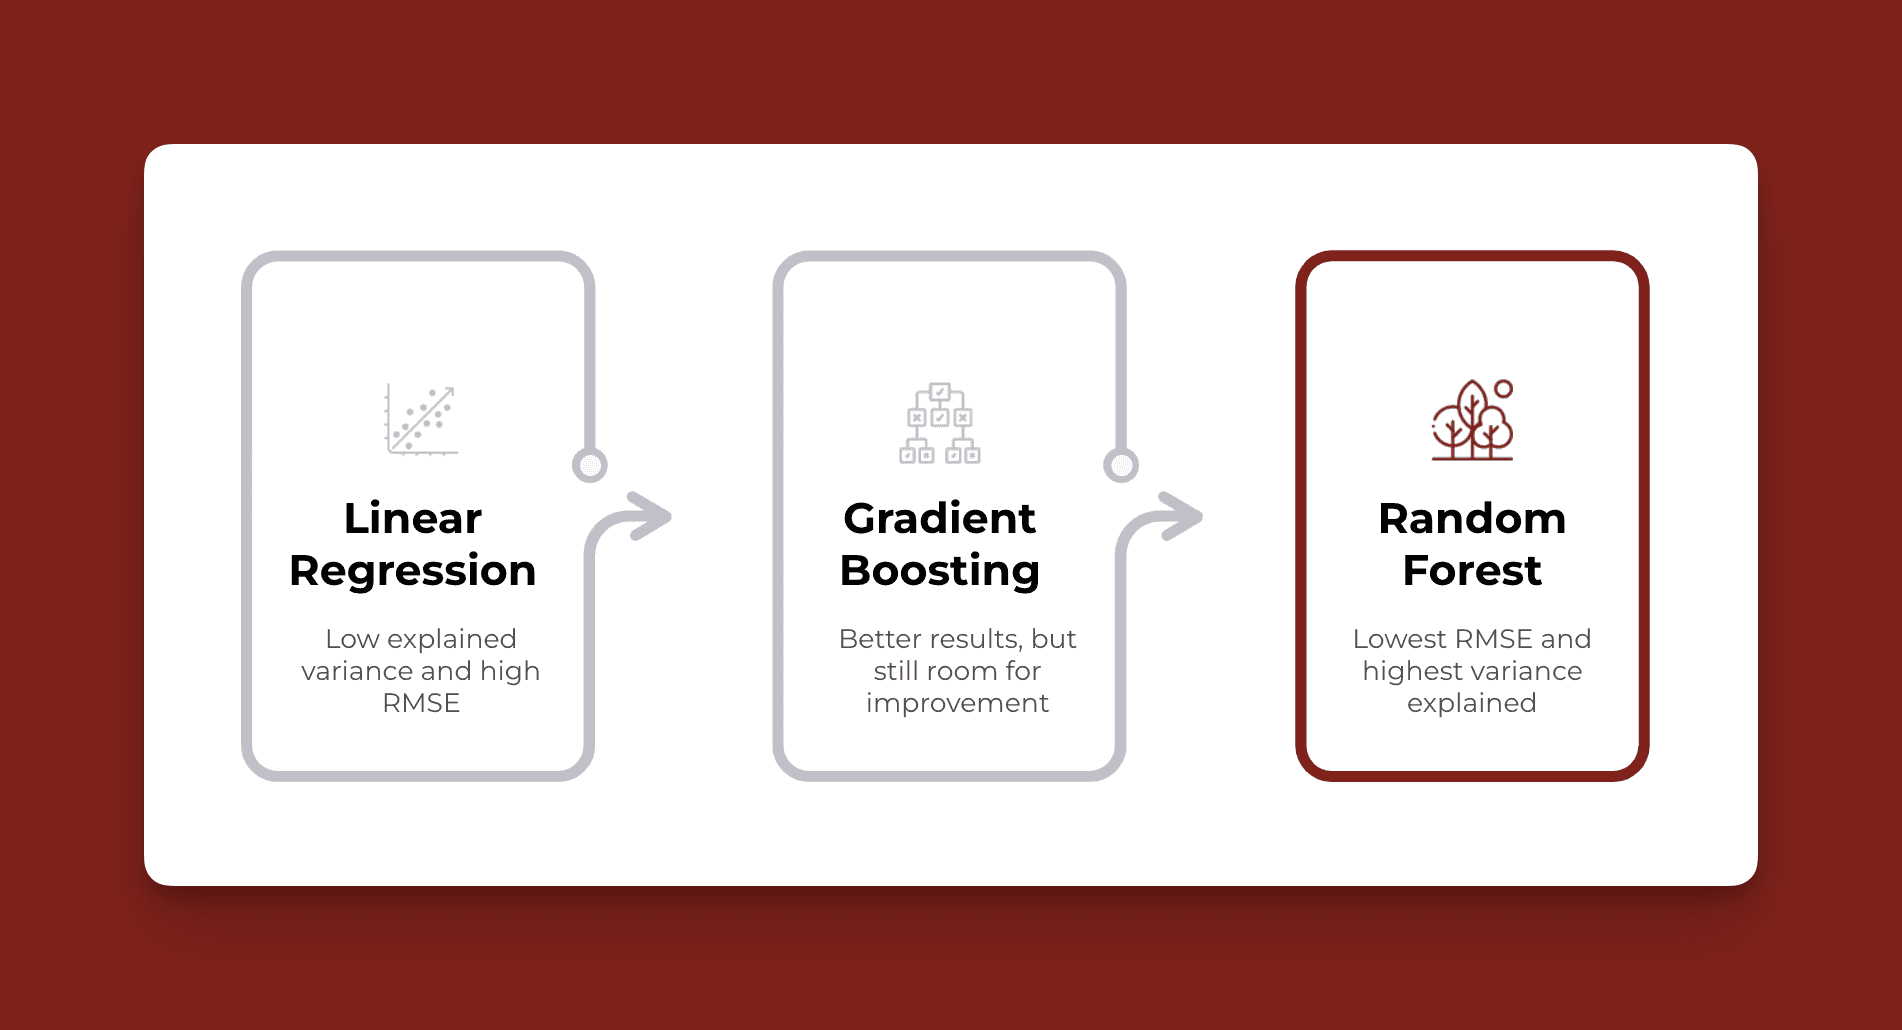
To explore the relationship between in-class activities and homework performance, we used three machine learning models:
Linear Regression: A simple approach that assumes relationships are linear.
Gradient Boosting: Captures complex relationships by iteratively improving predictions.
Random Forest: A collection of decision trees that work together to improve prediction accuracy and reduce overfitting.
Model Selection and Validation
To ensure that the chosen models were generalizable, we used a robust validation strategy:
Cross-Validation: We used 10-fold cross-validation to ensure that our models were not overfitting and had consistent performance across different subsets of the data.
Hyperparameter Tuning: For the Random Forest and Gradient Boosting models, we employed grid search to optimize hyperparameters like the number of estimators, maximum depth, and minimum samples split. This allowed us to fine-tune model performance for each analysis level.
Performance Metrics: We evaluated model performance using metrics like RMSE (Root Mean Square Error) to quantify the prediction error and Explained Variance to understand the proportion of variability captured by the model.
Results at Class-Lesson Level
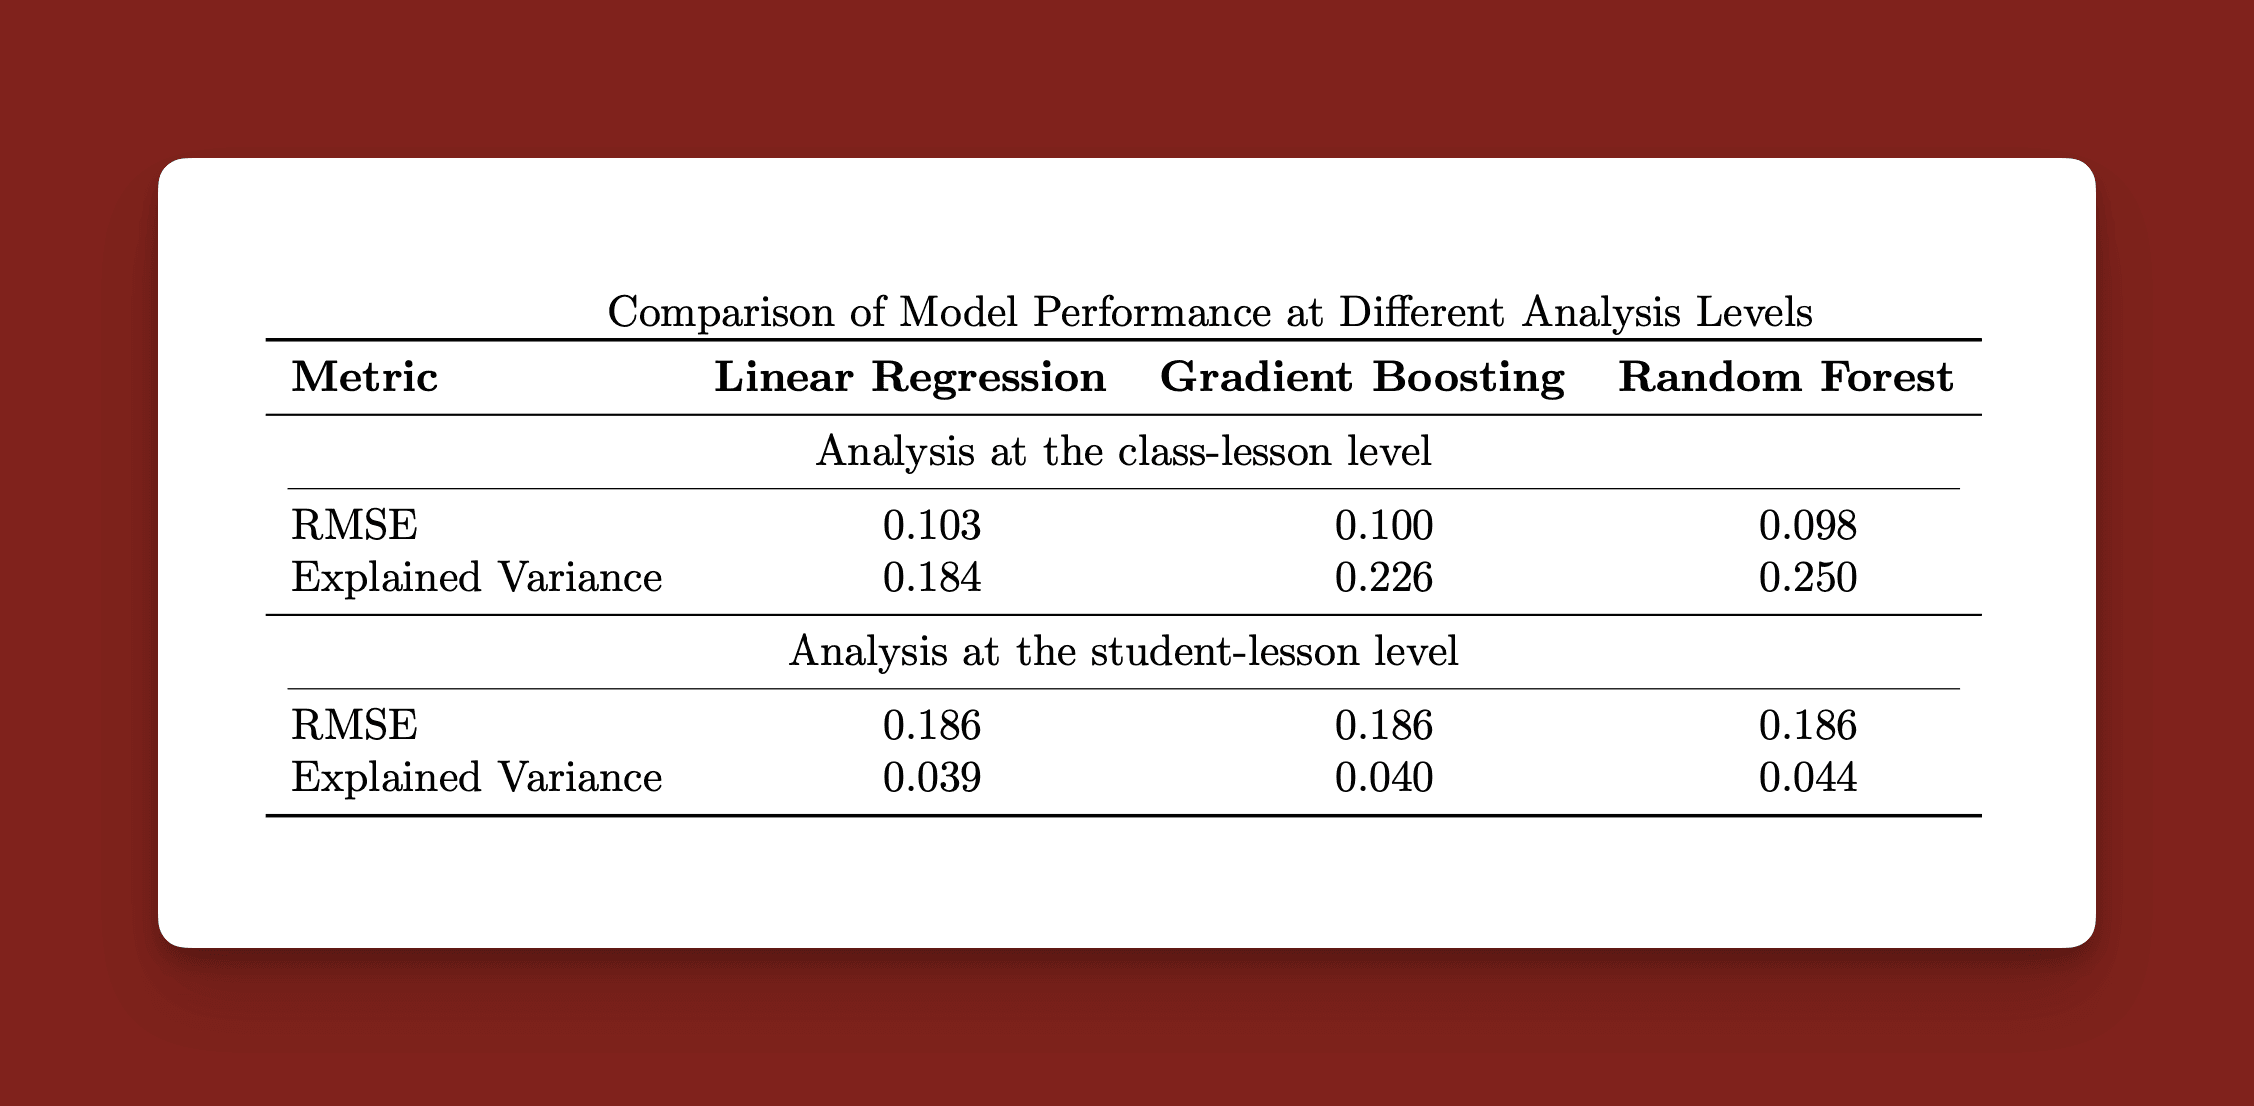
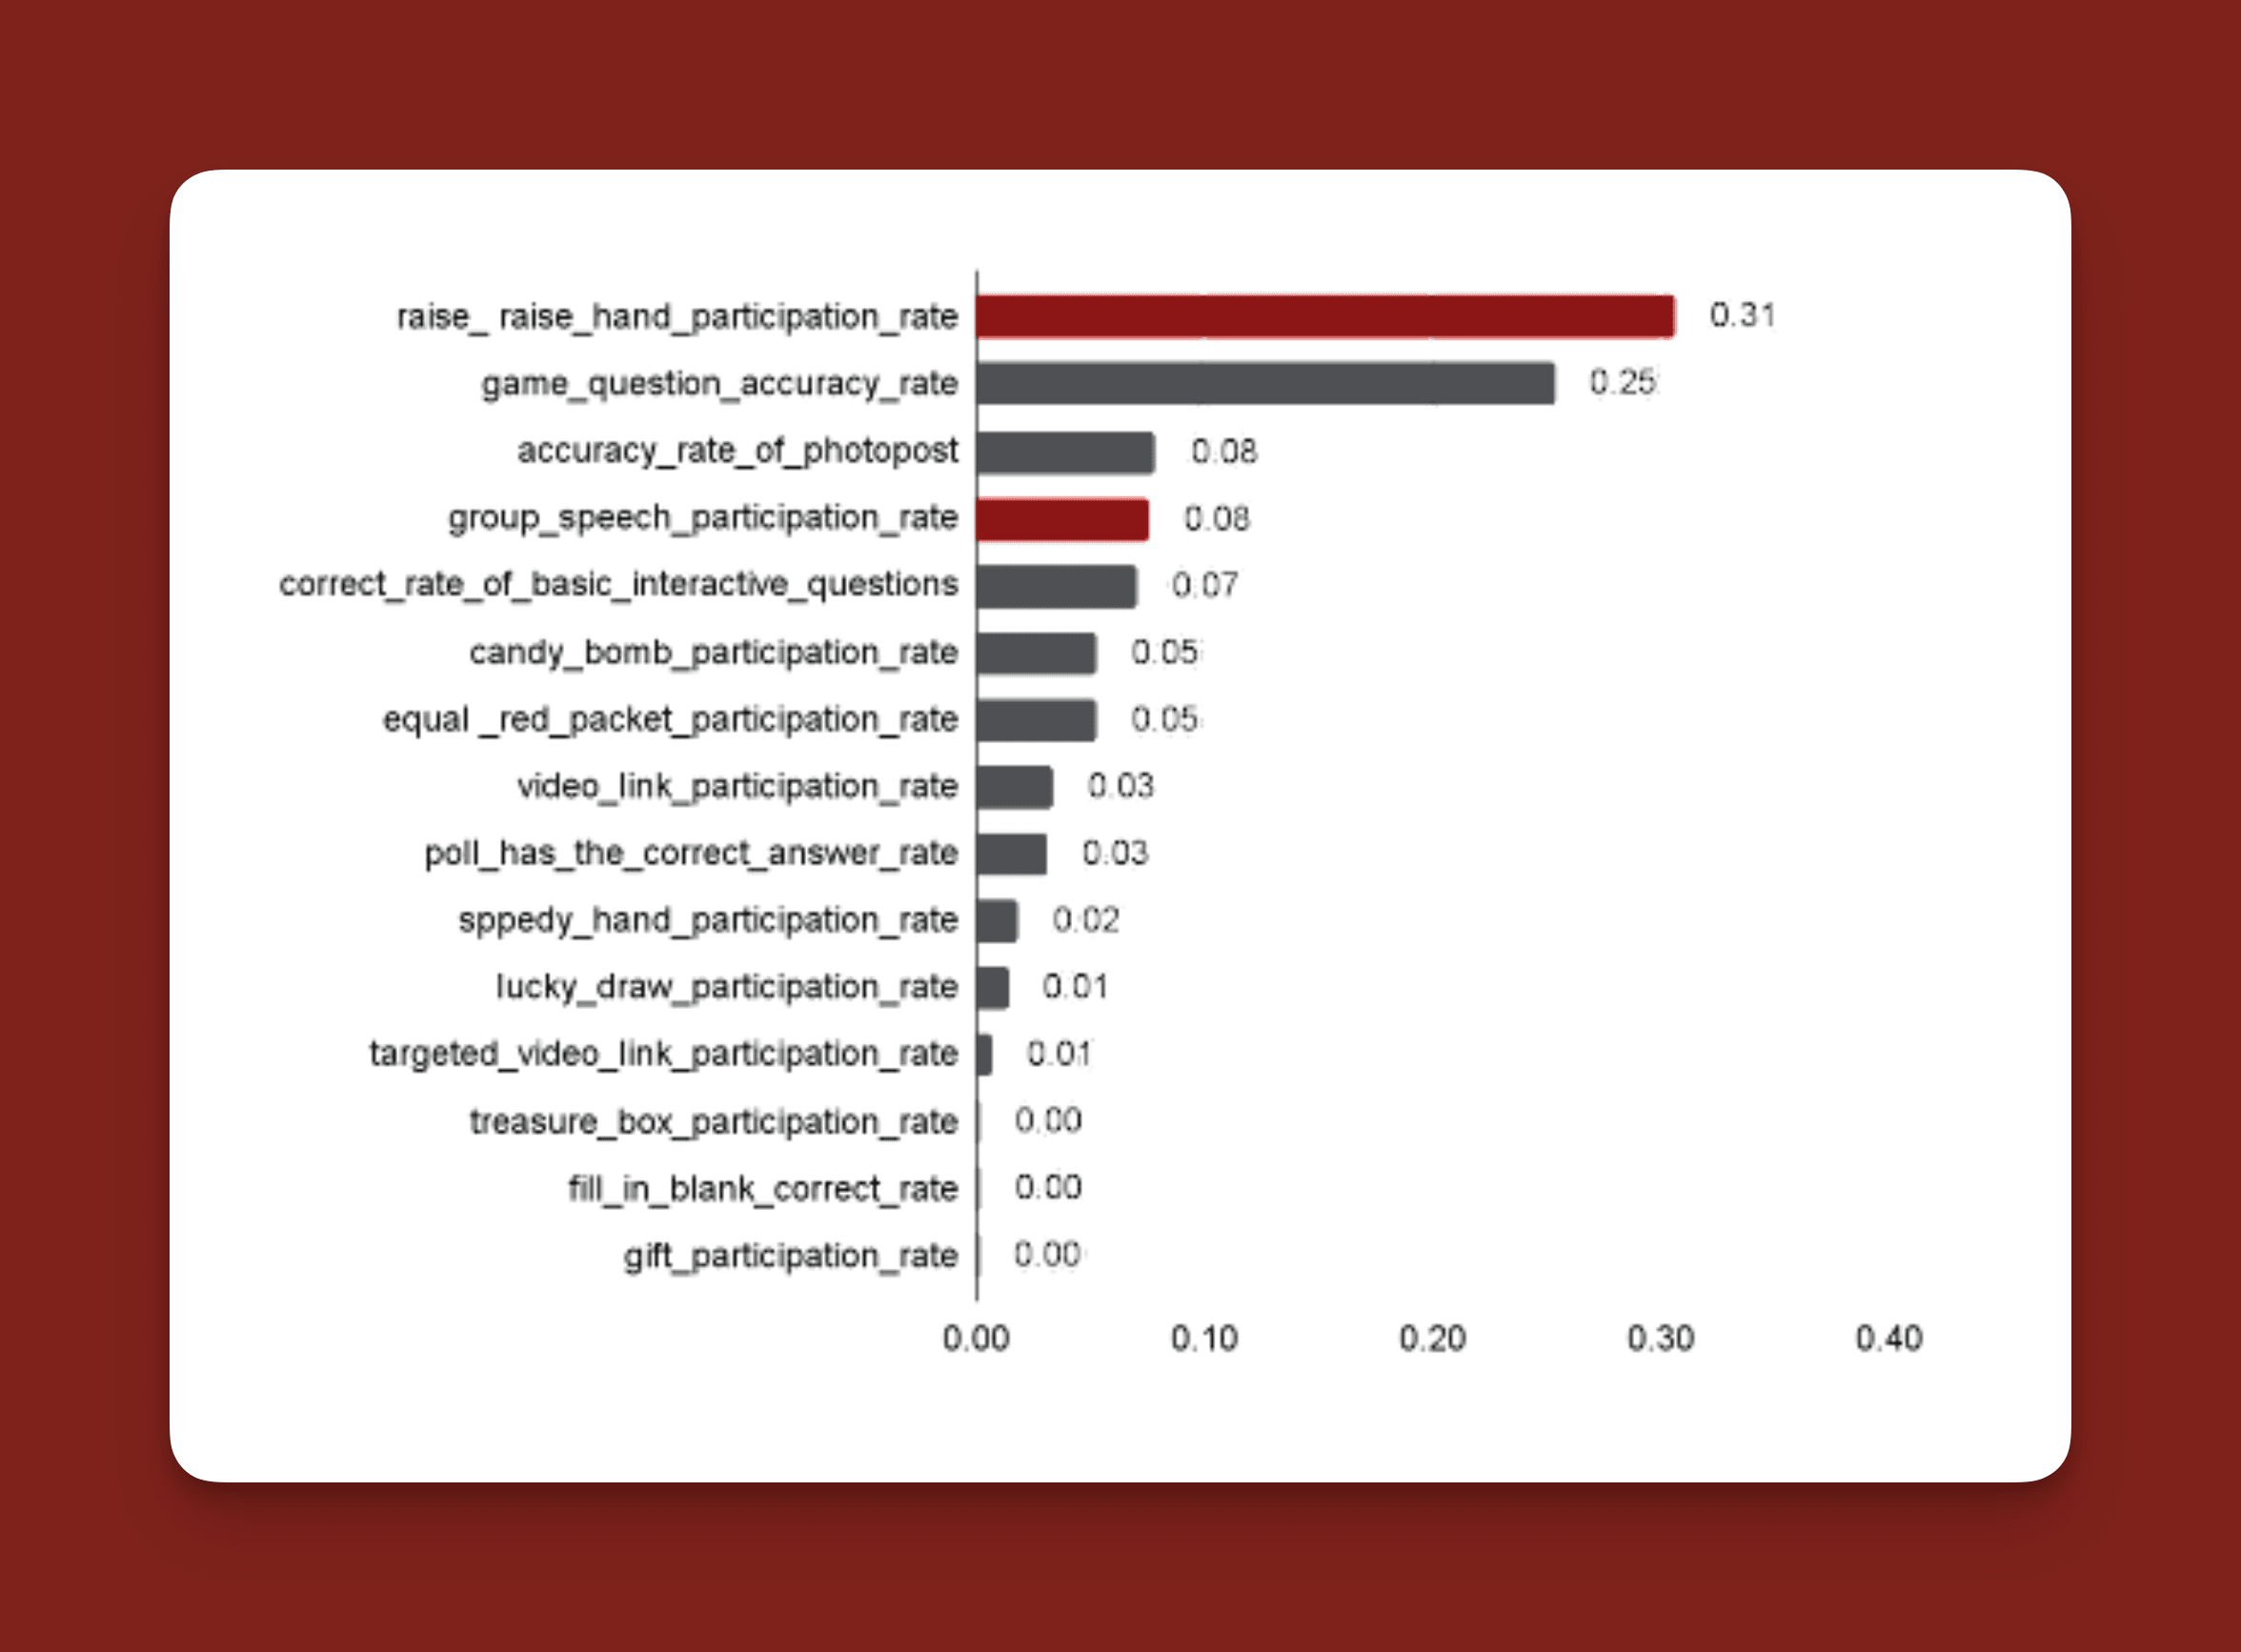
The Random Forest model had an RMSE of 0.098 and explained 25% of the variance in student homework performance at the class level. It was particularly insightful that game-based activities (like “Candy Bomb”) were among the most impactful predictors of performance. Also, activities involving voluntary participation, like raising hands, had a strong positive association with better homework scores. These results suggest that gamification and voluntary participation play key roles in driving engagement that correlates with homework success.
Results at Student-Lesson Level
At the individual student level, performance metrics were less impressive, with an RMSE of 0.186 and an explained variance of only 4.4%. The lower predictability here hints that factors beyond in-class activities significantly affect individual student outcomes—for example, student motivation, previous knowledge, or even socio-economic background.
Key Findings
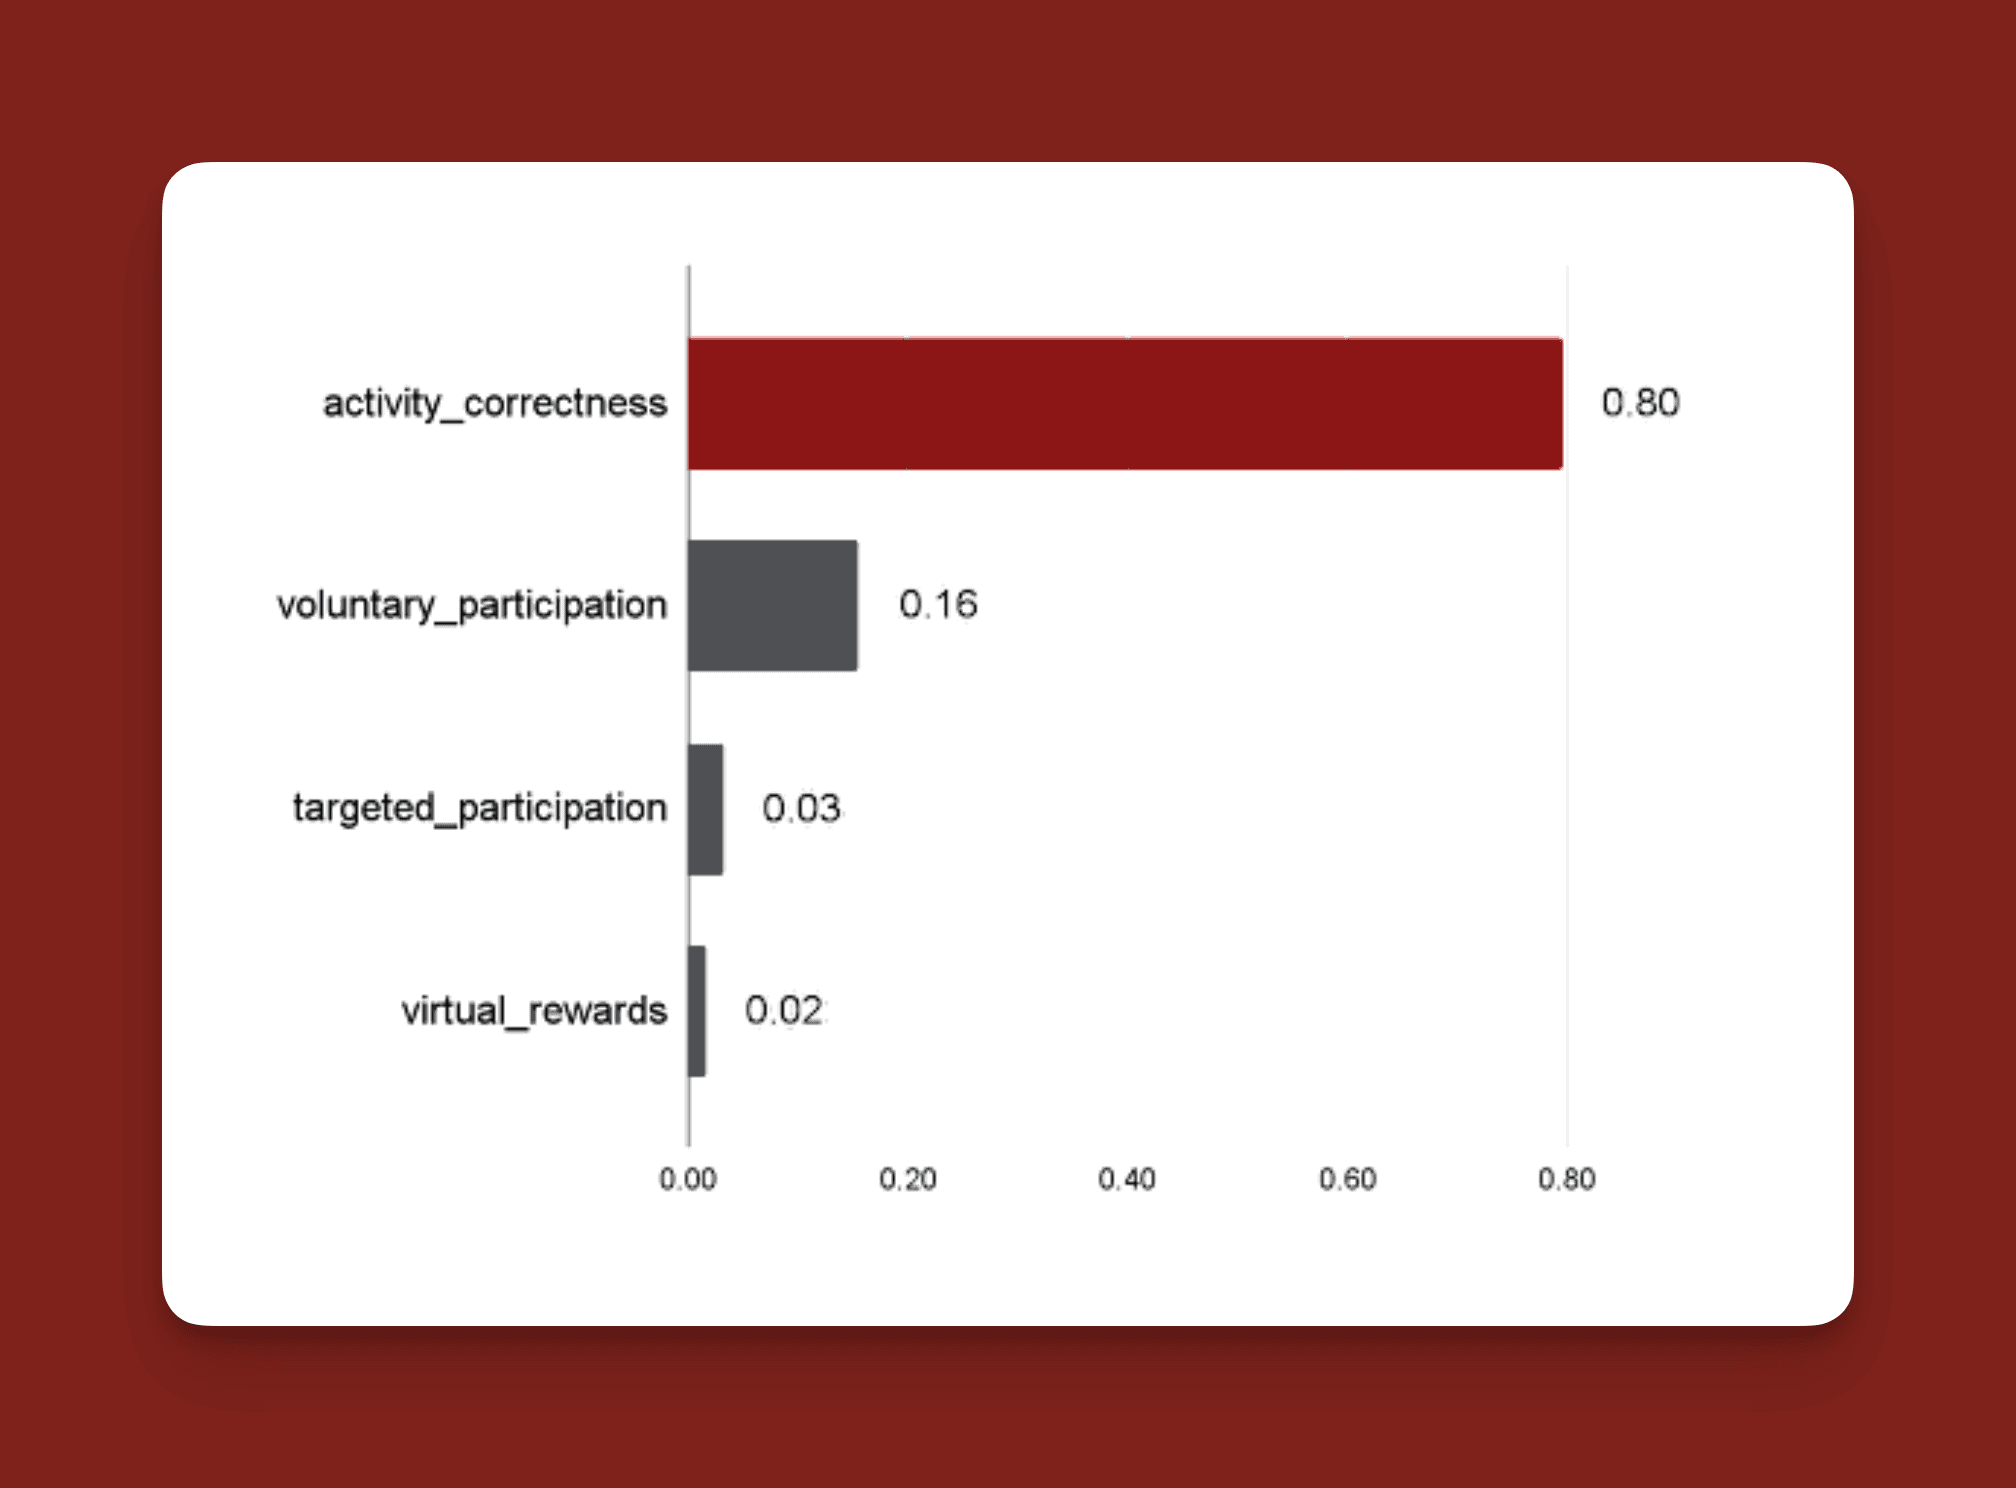
Content-Related Activities Matter Most: Gamified content questions showed the strongest correlation with homework success.
Voluntary Participation is Key: Students who raised hands and participated in group discussions tended to perform better on homework.
Class-Level vs Individual Analysis: Models performed better at predicting class-wide performance (25% explained variance) compared to individual performance (4.4% explained variance).
Discussion
While the models gave us valuable insights, they also underscored a key challenge: missing data and inconsistent activity logs. Not all activities were performed during each lesson, and the absence of proper zeros for students who were present but not participating limited the dataset’s completeness.
From these findings, we offer several recommendations to Think Academy:
Improve Data Collection: Consistency in data collection is vital. Ensure that even non-participation is logged explicitly to minimize missing data points.
Capture Activity Details: Collect more detailed information on activities—e.g., how often an activity is repeated and the sequence in which they occur.
Consider Long-Term Metrics: Rather than just using homework correctness, Think Academy could track student success over time—e.g., midterms or final exams—to capture long-term learning outcomes.
Student Profiles: Gather demographic and motivational data to develop more nuanced predictive models.
Conduct Experiments: Implement randomized controlled trials to better understand the causal effect of different teaching methods.
Despite limitations, our work showed that interactive and voluntary activities matter. By engaging students more actively during class and gamifying content, Think Academy can positively influence how students perform independently. There's a lot of potential here, but the key is consistency in data collection and a more holistic approach to understanding what makes students succeed.


